E-Hentai Statistics
From EHWiki
Jump to navigationJump to search
Various statistics about E-Hentai from various dates.
Chart
| Factor | Number | Date |
|---|---|---|
Overall | ||
| Annual cost of maintaining E-Hentai (USD) | $100,000 | 2013-01[1][2] |
| $56,000 | 2011-09[3] | |
| $46,000 | 2010-03[4] | |
| $4,800 | 2007-02[5] | |
| Total cumulative cost of maintaining E-Hentai (USD) | $200-300,000 | 2012-09[6] |
| Unique visits (last 30 days) | ~20,000,000 | 2013-10[7] |
| ~18,000,000 | 2013-08[IRC] | |
| ~11,000,000+ | 2012-11[8](Note) | |
| ~3,700,000 | 2010-03 | |
| ~3,000,000 | 2010-01[9][10][11][12][13] | |
| ~2,000,000 | 2009-07[14] | |
| ~1,700,000 | 2009-06[15] | |
| Non-Unique visits (last 30 days) | ~11,300,000 | 2010-06[16] |
| ~9,000,000 | 2009-11[17] | |
| ~8,000,000 | 2009-10[18] | |
| ~7,000,000 | 2009-09[19] | |
| ~6,000,000 | 2009-07 | |
| ~5,000,000 | 2009-06 | |
| Non-Unique pageviews (last 30 days) | ~11,664,000,000 | 2018-08[IRC] |
| ~3,888,000,000 | 2015-03[IRC] | |
| ~1,740,000,000 | 2013-11[IRC] | |
| 1,051,418,844 | 2011-08[20] | |
| ~600,000,000 | 2010-01[21] | |
| ~500,000,000 | 2009-11[22] | |
| ~400,000,000 | 2009-08[23] | |
| ~300,000,000 | 2009-06[24] | |
Hardware | ||
| Physical servers | 43 | 2015-02[IRC] |
| 38 | 2014-09[IRC] | |
| 34 | 2013-01[25] | |
| 21 | 2011-01[26] | |
| 20 | 2010-04[27] | |
| 15 | 2008-10[28] | |
| 6 | 2007-02[29] | |
| Harddrives | 260 HDD + 40 SSD | 2016-01[30] |
| Cumulative storage capacity | ~1 PB | 2016-01[31] |
Forums | ||
| Registered members | 10,039,893+ | 2026-06 |
| 9,683,327+ | 2026-01 | |
| 9,330,335+ | 2025-08 | |
| 7,753,365+ | 2023-10 | |
| 5,773,478+ | 2021-03 | |
| 5,568,700+ | 2020-11 | |
| 5,072,000+ | 2020-02 | |
| 4,809,000+ | 2019-07 | |
| 4,560,300+ | 2019-01 | |
| 4,332,100+ | 2017-07 | |
| 3,468,420+ | 2016-12 | |
| 3,166,550+ | 2016-06 | |
| 2,792,570+ | 2015-11 | |
| 2,531,820+ | 2015-06 | |
| 2,130,670+ | 2014-11 | |
| 1,844,030+ | 2014-04 | |
| 1,565,000+ | 2013-10 | |
| 1,398,100+ | 2013-06 | |
| 1,233,000+ | 2013-01 | |
| 1,146,000+ | 2012-10 | |
| 1,057,000+ | 2012-07 | |
| 960,000+ | 2012-05 | |
| 744,500+ | 2011-09 | |
| 500,000+ | 2010-12 | |
| 250,000+ | 2009-12 | |
| 103,800+ | 2008-12 | |
| 50,000+ | 2008-04 | |
| 27,400+ | 2007-08 | |
| 9,000+ | 2006-12 | |
| 5,000+ | 2006-09 | |
| 3,000+ | 2006-06 | |
| 2,000+ | 2006-04 | |
| 500+ | 2005-07 | |
| Forum posts | 4,894,136+ | 2026-06 |
| 4,799,723+ | 2026-01 | |
| 4,716,296+ | 2025-08 | |
| 4,389,348+ | 2023-10 | |
| 3,890,434+ | 2021-03 | |
| 3,824,720+ | 2020-11 | |
| 3,633,990+ | 2020-02 | |
| 3,507,520+ | 2019-07 | |
| 3,359,570+ | 2019-01 | |
| 3,224,700+ | 2017-07 | |
| 2,730,800+ | 2016-12 | |
| 2,543,080 | 2016-06 | |
| 2,269,140+ | 2015-11 | |
| 3,067,810+ | 2015-06 | |
| 2,657,930+ | 2014-11 | |
| 2,215,958+ | 2014-04 | |
| 2,013,300+ | 2013-10 | |
| 1,825,800+ | 2013-06 | |
| 1,555,000+ | 2013-01 | |
| 1,391,000+ | 2012-10 | |
| (~500,000 wiped) | 2012-07[32] | |
| 1,700,000+ | 2012-05 | |
| 1,316,500+ | 2011-09 | |
| 258,100+ | 2008-12 | |
| 110,700+ | 2007-08 | |
| 36,900+ | 2006-12 | |
| 9,300+ | 2006-06 | |
| 5,100+ | 2006-04 | |
H@H | ||
| Image requests handled | 98% | 2014-07[33] |
| 92-98% | 2012-21[34] | |
| 90-95% | 2012-06[35] | |
| 83-86% | 2011-12[36] | |
| 80% | 2011-09[37] | |
| 10% | 2008-04[38] | |
| Average fail rate for the internal tester | 1.7% | 2012-06[39] |
| Average active clients | ~3,000 | 2016-06[40] |
| 674 | 2012-07[IRC] | |
| Aggregate bandwidth capacity (Gb/s) | 62.3 | 2016-08 |
| 57.1 | 2016-02 | |
| 10.0 | 2013-02[41] | |
| 4.5 | 2012-11[42] | |
| 3.3 | 2012-07[IRC] | |
| 1.0 | 2009-10[43] | |
| Aggregate hath generated per day | ~25,000 | 2016-10[44] |
| Active file set size (TB) | 15-20 | 2016-08[45] |
| Aggregate bandwidth utilized (peak Gb/s) | 16-17 | 2019-07[IRC] |
| 12-14 (weekends) | 2018-08[IRC] | |
| ~3.9 | 2017-02 | |
| 2 | 2012-07[46] | |
Galleries | ||
| Standard galleries | ~1,516,150 | 2026-06 |
| ~1,497,601 | 2026-01 | |
| ~1,339,846 | 2025-08 | |
| ~972,720 | 2023-10 | |
| ~613,127 | 2021-03 | |
| ~577,894 | 2020-11 | |
| ~510,796 | 2020-02 | |
| ~439,180 | 2019-01 | |
| ~408,711 | 2017-07 | |
| ~327,276 | 2016-12 | |
| ~308,993 | 2016-06 | |
| ~283,471 | 2015-11 | |
| ~269,012 | 2015-07 | |
| ~240,753 | 2014-11 | |
| ~220,942 | 2014-04 | |
| ~203,104 | 2013-11 | |
| ~187,524 | 2013-06 | |
| ~173,988 | 2013-01 | |
| ~167,556 | 2012-10 | |
| ~162,000 | 2012-07 | |
| ~152,000 | 2012-05 | |
| ~250,000 | 2011-10[47] | |
| ~200,000 | 2010-02[48] | |
| ~100,000 | 2009-10[49] | |
| ~32,500 | 2008-08 | |
| ~1,200 | 2007-08 | |
| Proportion of AI Generated galleries | ~19.4% | 2026-06 |
| ~10.1% | 2026-01 | |
| ~8.3% | 2025-08 | |
| Unique tag IDs | 519,869 | 2026-06 |
| 517,247 | 2026-01 | |
| 513,643 | 2025-08 | |
| 498,852 | 2023-10 | |
| 466,137 | 2021-03 | |
| 458,455 | 2020-11 | |
| 441,937 | 2020-02 | |
| 415,006 | 2019-01 | |
| 404,005 | 2017-07 | |
| 376,018 | 2017-03[IRC] | |
| 370,570 | 2016-12 | |
| 361,574 | 2016-06 | |
| 354,852 | 2016-01 | |
| 339,606 | 2015-05 | |
| 330,600 | 2015-01 | |
| 322,096 | 2014-09 | |
| 307,854 | 2014-03 | |
| 305,052 | 2013-01 | |
| 298,490 | 2013-11 | |
| 274,082 | 2013-02 | |
| 238,003 | 2012-09[50] | |
| Downloads per week | 170,000 | 2012-09[51] |
| Torrents | ~844,060 | 2026-06 |
| ~660,481 | 2025-08 | |
| ~419,386 | 2023-10 | |
| ~210,848 | 2021-03 | |
| ~198,689 | 2020-11 | |
| ~163,053 | 2020-02 | |
| ~138,909 | 2019-01 | |
| ~137,752 | 2017-07 | |
| ~119,134 | 2016-12 | |
| ~110,971 | 2016-06 | |
| ~106,234 | 2016-01 | |
| ~102,432 | 2015-07 | |
| ~99,754 | 2014-11 | |
| ~97,900 | 2014-04 | |
| ~85,655 | 2013-11 | |
| ~87,804 | 2013-06 | |
| ~77,924 | 2013-01 | |
| ~62,420 | 2012-07 | |
| ~60,000 | 2012-05 | |
| Renames per week | 1,027+ | 2015-07 |
| 585+ | 2014-07 | |
| 630+ | 2013-04 | |
| 750+ | 2012-07 | |
| Unique files (not counting thumbnails) | 47,998,400 | 2017-02[IRC] |
| 50,000,000+ (includes resamples) | 2012-05[52] | |
| 22,830,990 | 2011-12[53] | |
| Average views per uploaded file (popular categories) | 1,200 | 2012-01[54] |
| Average views per uploaded file (Non-H category) | 179 | 2012-01 |
| Average tags/ratings made | 3 per second | 2011-11[55] |
| Growth rate (Traffic) | 5-10% per month | 2011-11[56] |
| Growth rate (Storage) | 10-15% per month | 2011-11 |
| Growth rate (Database) | 10-15% per month | 2011-11 |
| Total image backup size | 160 TB (+40 TB resamples) | 2023-12[IRC] |
| 25 TB (+10 TB for all resamples) | 2017-02[IRC] | |
| 18 TB (Includes 1200x resamples) | 2013-04[IRC] | |
| ~16 TB | 2011-11 | |
| Under 750 GB | 2009-11 | |
| Compressed database size | 3.5 GB | 2011-11 |
| 480 MB | 2009-11 | |
| Online copies of each image | 6+ (Servers alone) | 2016-01[57] |
| 4-16 (H@H & Servers) | 2011-05[58] | |
| Galleries with torrents | 32% | 2020-02 |
| ~31% | 2019-01 | |
| ~22% | 2015-07 | |
| ~24% | 2014-04 | |
| ~25% | 2013-06 | |
| Gallery Points in circulation | 48,787,154,519 | 2014-01[IRC] |
HentaiVerse | ||
| Total Custom Monsters | 42,086 | 2013-11[59] |
| 42,126 | 2013-05[60] | |
| 37,004 | 2012-06[61] | |
| Custom Monsters above PL 250 | 4,319 | 2013-05 |
| Custom Monsters below PL 250 | 37,807 | 2013-05 |
| Custom Monsters at or above PL 25 | 16,679 | 2012-06 |
| Custom Monsters below PL 25 | 20,325 | 2012-06 |
| Total MoogleMail messages sent | 2,122,795+ | 2020-01 |
| 2,011,000+ | 2019-01 | |
| 1,382,300+ | 2015-07 | |
| 1,173,180+ | 2014-11 | |
| 1,070,200+ | 2014-07 | |
| 827,000+ | 2013-11 | |
| 685,200+ | 2013-06 | |
| 552,500+ | 2013-02 | |
| 462,000+ | 2012-11 | |
| 300,000+ | 2012-06 | |
| Item Bot credits used | 37,000,000 | 2012-06[62] |
| Item Bot credit profits shared | 5,200,000 | 2012-06 |
Equipment | ||
| Total generated | ~3,000,000 | 2013-07[IRC] |
| Total table size | 2.1 GB | 2014-05[63] |
| 1.2 GB | 2013-07[IRC] | |
| Amount still in circulation | 11% | 2013-07[IRC] |
| Peerless equipment generated | 34 | 2014-01[64] |
![[42]](https://ehwiki.org/images/archive/e/e9/20160210185111%21H%40H_Application.png)
Other Notables
- Odds of a file hash collision: 1 in 1,830,000,000,000,000,000,000,000,000,000,000,000,000[65]
- Within the top 100 sites in Japan (~63)
- Highest share of visitors are from: Japan[66][67] (~22%)
- Within the top 500 sites worldwide (~165)
See also
- Anatomy of the E-Hentai infrastructure (Q3 2011) (Missing chart image can be found here)
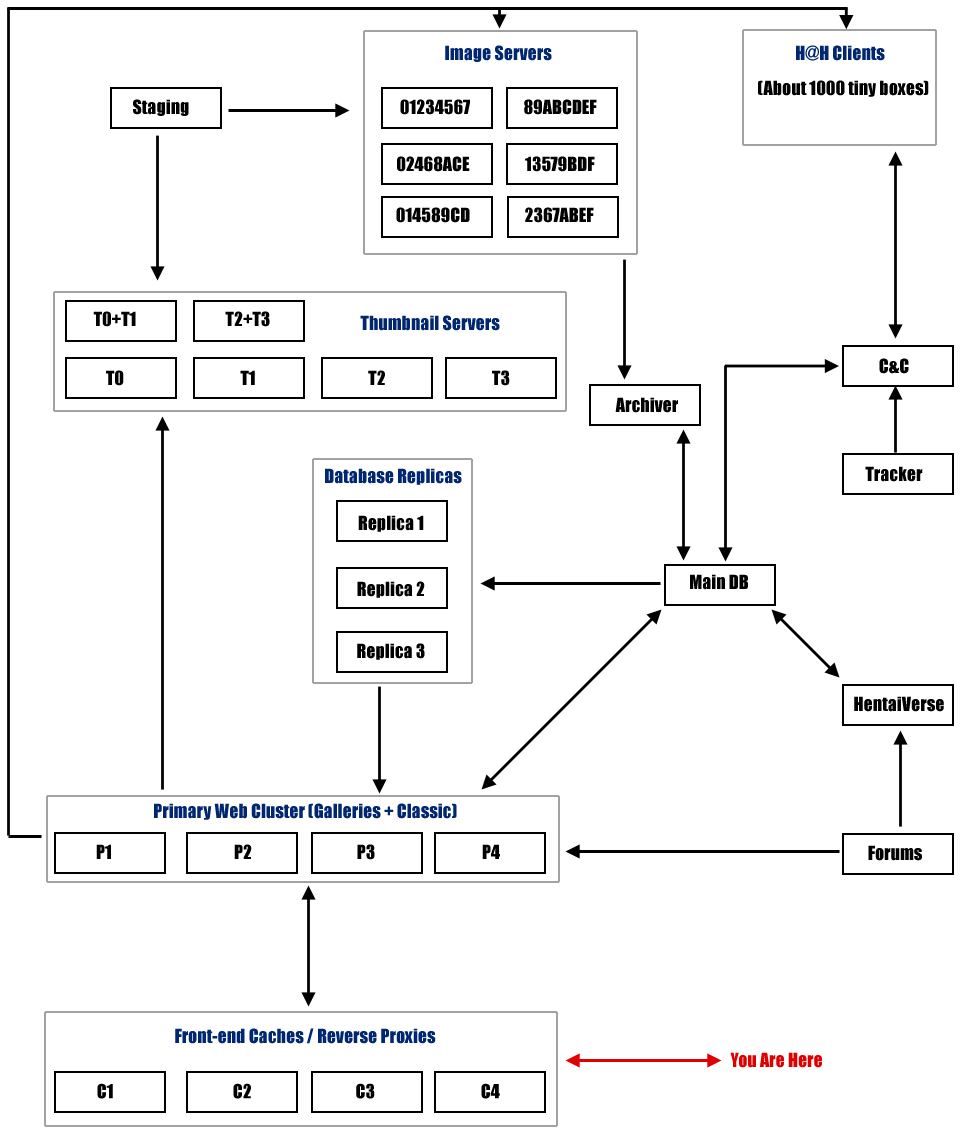