E-Hentai Statistics: Difference between revisions
From EHWiki
Jump to navigationJump to search
Maximum Joe (talk | contribs) |
Maximum Joe (talk | contribs) m →Overall |
||
| Line 50: | Line 50: | ||
|~5,000,000 || June 2009 | |~5,000,000 || June 2009 | ||
|- | |- | ||
|rowspan=" | |rowspan="6"|Non-Unique pageviews (last 30 days) || <span title="~73,000,000 on Sundays, 58,000,000 on other days" style="border-bottom:1px dotted">~1,740,000,000</span> || Nov. 2013<sup>[IRC]</sup> | ||
|- | |- | ||
|1,051,418,844 || Aug. 2011<sup>[http://twitter.com/ehentai/status/107193125809827840]</sup> | |1,051,418,844 || Aug. 2011<sup>[http://twitter.com/ehentai/status/107193125809827840]</sup> | ||
Revision as of 02:41, 5 March 2014
Various statistics about E-Hentai from various dates.
Chart
| Factor | Number | Date |
|---|---|---|
Overall | ||
| Annual cost of maintaining E-Hentai | $100,000 USD | Jan. 2013[1][2] |
| $56,000 USD | Sept. 2011[3] | |
| $46,000 USD | Mar. 2010[4] | |
| Total cumulative cost of maintaining E-Hentai | $200-300,000 USD | Sept. 2012[5] |
| Number of servers | 34 | Jan. 2013[6] |
| 21 | Jan. 2011[7] | |
| 15 | Oct. 2008[8] | |
| Unique visits (last 30 days) | ~20,000,000 | Oct. 2013[9] |
| ~18,000,000 | Aug. 2013[IRC] | |
| 11,000,000+ | Nov. 2012[10](Note) | |
| ~3,700,000 | Mar. 2010 | |
| ~3,000,000 | Jan. 2010[11][12][13][14][15] | |
| ~2,000,000 | July 2009[16] | |
| ~1,700,000 | June 2009[17] | |
| Non-Unique visits (last 30 days) | ~11,300,000 | June 2010[18] |
| ~9,000,000 | Nov. 2009[19] | |
| ~8,000,000 | Oct. 2009[20] | |
| ~7,000,000 | Sept. 2009[21] | |
| ~6,000,000 | July 2009 | |
| ~5,000,000 | June 2009 | |
| Non-Unique pageviews (last 30 days) | ~1,740,000,000 | Nov. 2013[IRC] |
| 1,051,418,844 | Aug. 2011[22] | |
| ~600,000,000 | Jan. 2010[23] | |
| ~500,000,000 | Nov. 2009[24] | |
| ~400,000,000 | Aug. 2009[25] | |
| ~300,000,000 | June 2009[26] | |
Forums | ||
| Registered members | 1,565,000+ | Oct. 2013 |
| 1,398,100+ | June 2013 | |
| 1,233,000+ | Jan. 2013 | |
| 1,146,000+ | Oct. 2012 | |
| 1,057,000+ | July 2012 | |
| 960,000+ | May 2012 | |
| Forum posts | 2,013,300+ | Oct. 2013 |
| 1,825,800+ | June 2013 | |
| 1,555,000+ | Jan. 2013 | |
| 1,391,000+ | Oct. 2012 | |
| (~500,000 wiped) | July 2012 [27] | |
| 1,700,000+ | May 2012 | |
H@H | ||
| Image requests handled | 92-98% | Dec. 2012[28] |
| 90-95% | June 2012[29] | |
| 83-86% | Dec. 2011[30] | |
| 80% | Sept. 2011[31] | |
| 10% | Apr. 2008[32] | |
| Average fail rate for the internal tester | 1.7% | June 2012[33] |
| Average number of active clients | 674 | July 2012[IRC] |
| Aggregate bandwidth capacity | 10.0 Gb/s | Feb. 2013[34] |
| 3.3 Gb/s | July 2012[IRC] | |
| 1.0 Gb/s | Oct. 2009[35] | |
| Aggregate bandwidth utilized (peak) | 2 Gb/s+ | July 2012[36] |
Galleries | ||
| Standard galleries | ~5,077,600 | Nov. 2013 |
| ~4,688,100 | June 2013 | |
| ~4,349,700 | Jan. 2013 | |
| ~4,188,900 | Oct. 2012 | |
| ~4,050,000 | July 2012 | |
| ~3,800,000 | May 2012 | |
| ~2,500,000 | Oct. 2011[37] | |
| ~200,000 | Feb. 2010[38] | |
| ~100,000 | Oct. 2009[39] | |
| Unique tags | 305,052 | Jan. 2013 |
| 298,490 | Nov. 2013 | |
| 274,082 | Feb. 2013 | |
| 238,003 | Sept. 2012[40] | |
| Downloads per week | 170,000 | Sept. 2012[41] |
| Torrents | ~2,141,375 | Nov. 2013 |
| ~2,195,100 | June 2013 | |
| ~1,948,100 | Jan. 2013 | |
| ~1,560,500 | July 2012 | |
| ~1,500,000 | May 2012 | |
| Renames per week | 630+ | Apr. 2013 |
| 750+ | July 2012 | |
| Unique files (not counting thumbnails) | 50,000,000+ | May 2012[42] |
| 22,830,990 | Dec. 2011[43] | |
| Odds of a file hash collision | 1 in 1,830,000,000,000,000,000,000,000,000,000,000,000,000 | May 2012[44] |
| Average views per uploaded file (popular categories) | 1,200 | Jan. 2012[45] |
| Average views per uploaded file (Non-H category) | 179 | Jan. 2012 |
| Average number of tags/ratings made | 3 per second | Nov. 2011[46] |
| Growth rate (Traffic) | 5-10% per month | Nov. 2011[47] |
| Growth rate (Storage) | 10-15% per month | Nov. 2011 |
| Growth rate (Database) | 10-15% per month | Nov. 2011 |
| Total image backup size | 18 TB | Apr. 2013[IRC] |
| ~16 TB | Nov. 2011 | |
| Under 750 GB | Nov. 2009 | |
| Compressed database size | 3.5 GB | Nov. 2011 |
| 480 MB | Nov. 2009 | |
| Online copies of each image | 4-16 | May 2011[48] |
| Galleries with torrents | ~25% | June 2013 |
| Gallery Points in circulation | 48,787,154,519 | Jan. 2014[IRC] |
Expunging Totals | ||
| Duplicates | ~36,000 | Jan. 2013 |
| Replacements | ~12,100 | Jan. 2013 |
| Real porn | 27,500 | Jan. 2013 |
| Prohibited content | 6,300+ | Jan. 2013 |
| 4,100+ | July 2012 | |
| Compilations | ~1,900 | Jan. 2013 |
| ~1,500 | July 2012 | |
HentaiVerse | ||
| Total Custom Monsters | 42,086 | Nov. 2013[49] |
| (~7,000 wiped) | Nov. 2013 | |
| 42,126 | May 2013[50] | |
| 37,004 | June 2012[51] | |
| Custom Monsters above PL 250 | 4,319 | May 2013 |
| Custom Monsters below PL 250 | 37,807 | May 2013 |
| Custom Monsters at or above PL 25 | 16,679 | June 2012 |
| Custom Monsters below PL 25 | 20,325 | June 2012 |
| MoogleMail messages sent | 827,000+ | Nov. 2013 |
| 685,200+ | June 2013 | |
| 552,500+ | Feb. 2013 | |
| 462,000+ | Nov. 2012 | |
| 300,000+ | June 2012 | |
| Item Bot credits used | 37,000,000 | June 2012[52] |
| Item Bot credit profits shared | 5,200,000 | June 2012 |
Equipment | ||
| Total generated | ~3,000,000 | July 2013[IRC] |
| Total table size | 1.2 GB | July 2013[IRC] |
| Amount still in circulation | 11% | July 2013[IRC] |
| Peerless equipment generated | 34 | Jan. 2014[53] |
Other Notables
- Within the top 500 sites in Japan[54] (Current Estimate: ~309)
- Highest share of visitors are from: Japan[55][56] (As of Apr. 2013: ~20%)
- Within the top 1,500 sites worldwide (Current Estimate: ~1,475)
See also
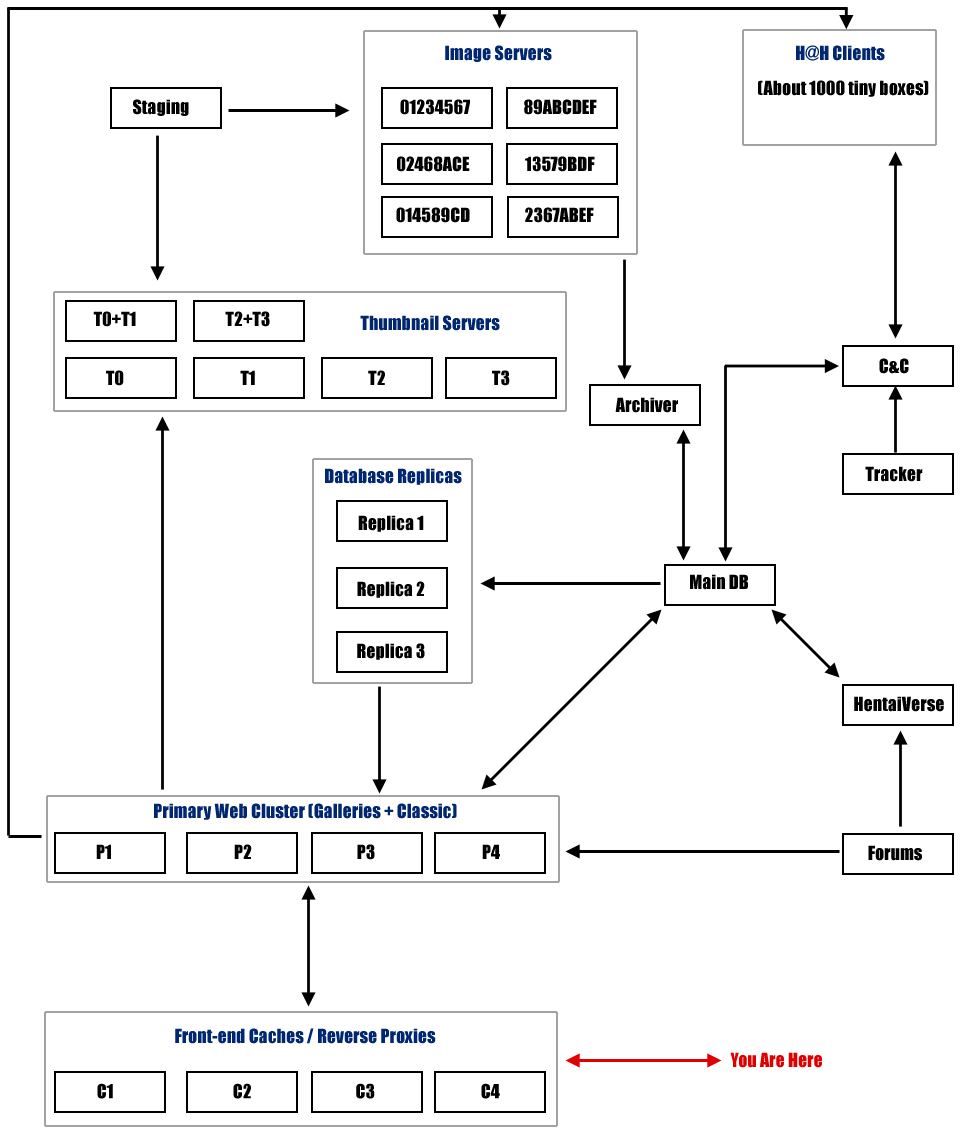
- Anatomy of the E-Hentai infrastructure (Missing chart image can be found here)