E-Hentai Statistics: Difference between revisions
From EHWiki
Jump to navigationJump to search
Maximum Joe (talk | contribs) |
Maximum Joe (talk | contribs) |
||
| Line 85: | Line 85: | ||
===[[Forums]]=== | ===[[Forums]]=== | ||
|- | |- | ||
|rowspan=" | |rowspan="18"|Registered members || 3,166,550+ || 2016-06 | ||
| | |||
|2,792,570+ || 2015-11 | |||
|- | |- | ||
|2,531,820+ || 2015-06 | |2,531,820+ || 2015-06 | ||
| Line 119: | Line 121: | ||
|500+ || 2005-07 | |500+ || 2005-07 | ||
|- | |- | ||
|rowspan=" | |rowspan="12"|[[Forum]] posts || 2,543,080 || 2016-06 | ||
|- | |||
|2,269,140+ || 2015-11 | |||
|- | |- | ||
|(''Spamhaus subforum formally purged from the system'') || 2015 Q3<sup>[IRC]</sup> | |(''Spamhaus subforum formally purged from the system'') || 2015 Q3<sup>[IRC]</sup> | ||
Revision as of 01:43, 15 June 2016
Various statistics about E-Hentai from various dates.
Chart
| Factor | Number | Date | |||
|---|---|---|---|---|---|
Overall | |||||
| Annual cost of maintaining E-Hentai (USD) | $100,000 | 2013-01[1][2] | |||
| $56,000 | 2011-09[3] | ||||
| $46,000 | 2010-03[4] | ||||
| $4,800 | 2007-02[5] | ||||
| Total cumulative cost of maintaining E-Hentai (USD) | $200-300,000 | 2012-09[6] | |||
| Unique visits (last 30 days) | ~20,000,000 | 2013-10[7] | |||
| ~18,000,000 | 2013-08[IRC] | ||||
| ~11,000,000+ | 2012-11[8](Note) | ||||
| ~3,700,000 | 2010-03 | ||||
| ~3,000,000 | 2010-01[9][10][11][12][13] | ||||
| ~2,000,000 | 2009-07[14] | ||||
| ~1,700,000 | 2009-06[15] | ||||
| Non-Unique visits (last 30 days) | ~11,300,000 | 2010-06[16] | |||
| ~9,000,000 | 2009-11[17] | ||||
| ~8,000,000 | 2009-10[18] | ||||
| ~7,000,000 | 2009-09[19] | ||||
| ~6,000,000 | 2009-07 | ||||
| ~5,000,000 | 2009-06 | ||||
| Non-Unique pageviews (last 30 days) | ~3,888,000,000; One frontend server reported ~5,500,000,000 | 2015-03[IRC] | |||
| ~1,740,000,000 | 2013-11[IRC] | ||||
| 1,051,418,844 | 2011-08[20] | ||||
| ~600,000,000 | 2010-01[21] | ||||
| ~500,000,000 | 2009-11[22] | ||||
| ~400,000,000 | 2009-08[23] | ||||
| ~300,000,000 | 2009-06[24] | ||||
Hardware | |||||
| Physical servers | 43 | 2015-02[IRC] | |||
| 38 | 2014-09[IRC] | ||||
| 34 | 2013-01[25] | ||||
| 21 | 2011-01[26] | ||||
| 20 | 2010-04[27] | ||||
| 15 | 2008-10[28] | ||||
| 6 | 2007-02[29] | ||||
| Harddrives | 260 HDD + 40 SSD | 2016-01[30] | |||
| Cumulative storage capacity | ~1 PB | 2016-01[31] | |||
Forums | |||||
| Registered members | 3,166,550+ | 2016-06 | 2,792,570+ | 2015-11 | |
| 2,531,820+ | 2015-06 | ||||
| 2,130,670+ | 2014-11 | ||||
| 1,844,030+ | 2014-04 | ||||
| 1,565,000+ | 2013-10 | ||||
| 1,398,100+ | 2013-06 | ||||
| 1,233,000+ | 2013-01 | ||||
| 1,146,000+ | 2012-10 | ||||
| 1,057,000+ | 2012-07 | ||||
| 960,000+ | 2012-05 | ||||
| 750,000+ | 2011-09 | ||||
| 500,000+ | 2010-12 | ||||
| 250,000+ | 2009-12 | ||||
| 100,000+ | 2008-12 | ||||
| 50,000+ | 2008-04 | ||||
| 5,000+ | 2006-09 | ||||
| 500+ | 2005-07 | ||||
| Forum posts | 2,543,080 | 2016-06 | |||
| 2,269,140+ | 2015-11 | ||||
| (Spamhaus subforum formally purged from the system) | 2015 Q3[IRC] | ||||
| 3,067,810+ | 2015-06 | ||||
| 2,657,930+ | 2014-11 | ||||
| 2,215,958+ | 2014-04 | ||||
| 2,013,300+ | 2013-10 | ||||
| 1,825,800+ | 2013-06 | ||||
| 1,555,000+ | 2013-01 | ||||
| 1,391,000+ | 2012-10 | ||||
| (~500,000 wiped) | 2012-07[32] | ||||
| 1,700,000+ | 2012-05 | ||||
H@H | |||||
| Image requests handled | 98% | 2014-07[33] | |||
| 92-98% | 2012-21[34] | ||||
| 90-95% | 2012-06[35] | ||||
| 83-86% | 2011-12[36] | ||||
| 80% | 2011-09[37] | ||||
| 10% | 2008-04[38] | ||||
| Average fail rate for the internal tester | 1.7% | 2012-06[39] | |||
| Average active clients | 674 | 2012-07[IRC] | |||
| Aggregate bandwidth capacity | 10.0 Gb/s | 2013-02[40] | |||
| 3.3 Gb/s | 2012-07[IRC] | ||||
| 1.0 Gb/s | 2009-10[41] | ||||
| Aggregate bandwidth utilized (peak) | 2 Gb/s+ | 2012-07[42] | |||
Galleries | |||||
| Standard galleries | ~283,471 | 2015-11 | |||
| ~269,012 | 2015-07 | ||||
| ~240,753 | 2014-11 | ||||
| ~220,942 | 2014-04 | ||||
| ~203,104 | 2013-11 | ||||
| ~187,524 | 2013-06 | ||||
| ~173,988 | 2013-01 | ||||
| ~167,556 | 2012-10 | ||||
| ~162,000 | 2012-07 | ||||
| ~152,000 | 2012-05 | ||||
| ~250,000 | 2011-10[43] | ||||
| ~200,000 | 2010-02[44] | ||||
| ~100,000 | 2009-10[45] | ||||
| Unique tags | 354,852 | 2016-01 | |||
| 339,606 | 2015-05 | ||||
| 330,600 | 2015-01 | ||||
| 322,096 | 2014-09 | ||||
| 307,854 | 2014-03 | ||||
| 305,052 | 2013-01 | ||||
| 298,490 | 2013-11 | ||||
| 274,082 | 2013-02 | ||||
| 238,003 | 2012-09[46] | ||||
| Downloads per week | 170,000 | 2012-09[47] | |||
| Torrents | ~106,234 | 2016-01 | |||
| ~102,432 | 2015-07 | ||||
| ~99,754 | 2014-11 | ||||
| ~97,900 | 2014-04 | ||||
| ~85,655 | 2013-11 | ||||
| ~87,804 | 2013-06 | ||||
| ~77,924 | 2013-01 | ||||
| ~62,420 | 2012-07 | ||||
| ~60,000 | 2012-05 | ||||
| Renames per week | 1,027+ | 2015-07 | |||
| 585+ | 2014-07 | ||||
| 630+ | 2013-04 | ||||
| 750+ | 2012-07 | ||||
| Unique files (not counting thumbnails) | 50,000,000+ | 2012-05[48] | |||
| 22,830,990 | 2011-12[49] | ||||
| Odds of a file hash collision | 1 in 1,830,000,000,000,000,000,000,000,000,000,000,000,000 | 2012-05[50] | |||
| Average views per uploaded file (popular categories) | 1,200 | 2012-01[51] | |||
| Average views per uploaded file (Non-H category) | 179 | 2012-01 | |||
| Average tags/ratings made | 3 per second | 2011-11[52] | |||
| Growth rate (Traffic) | 5-10% per month | 2011-11[53] | |||
| Growth rate (Storage) | 10-15% per month | 2011-11 | |||
| Growth rate (Database) | 10-15% per month | 2011-11 | |||
| Total image backup size | 18 TB | 2013-04[IRC] | |||
| ~16 TB | 2011-11 | ||||
| Under 750 GB | 2009-11 | ||||
| Compressed database size | 3.5 GB | 2011-11 | |||
| 480 MB | 2009-11 | ||||
| Online copies of each image | 6+ (Servers alone) | 2016-01[54] | |||
| 4-16 (H@H & Servers) | 2011-05[55] | ||||
| Galleries with torrents | ~22% | 2015-07 | |||
| ~24% | 2014-04 | ||||
| ~25% | 2013-06 | ||||
| Gallery Points in circulation | 48,787,154,519 | 2014-01[IRC] | |||
HentaiVerse | |||||
| Total Custom Monsters | 42,086 | 2013-11[56] | |||
| (~7,000 wiped) | 2013-11 | ||||
| 42,126 | 2013-05[57] | ||||
| 37,004 | 2012-06[58] | ||||
| Custom Monsters above PL 250 | 4,319 | 2013-05 | |||
| Custom Monsters below PL 250 | 37,807 | 2013-05 | |||
| Custom Monsters at or above PL 25 | 16,679 | 2012-06 | |||
| Custom Monsters below PL 25 | 20,325 | 2012-06 | |||
| Total MoogleMail messages sent | 1,382,300+ | 2015-07 | |||
| 1,173,180+ | 2014-11 | ||||
| 1,070,200+ | 2014-07 | ||||
| 827,000+ | 2013-11 | ||||
| 685,200+ | 2013-06 | ||||
| 552,500+ | 2013-02 | ||||
| 462,000+ | 2012-11 | ||||
| 300,000+ | 2012-06 | ||||
| Item Bot credits used | 37,000,000 | 2012-06[59] | |||
| Item Bot credit profits shared | 5,200,000 | 2012-06 | |||
Equipment | |||||
| Total generated | ~3,000,000 | 2013-07[IRC] | |||
| Total table size | 2.1 GB | 2014-05[60] | |||
| 1.2 GB | 2013-07[IRC] | ||||
| Amount still in circulation | 11% | 2013-07[IRC] | |||
| Peerless equipment generated | 34 | 2014-01[61] | |||
Other Notables
- Within the top 50 sites in Japan[62] (~31)
- Highest share of visitors are from: Japan[63][64] (~23%)
- Within the top 500 sites worldwide (~128)
See also
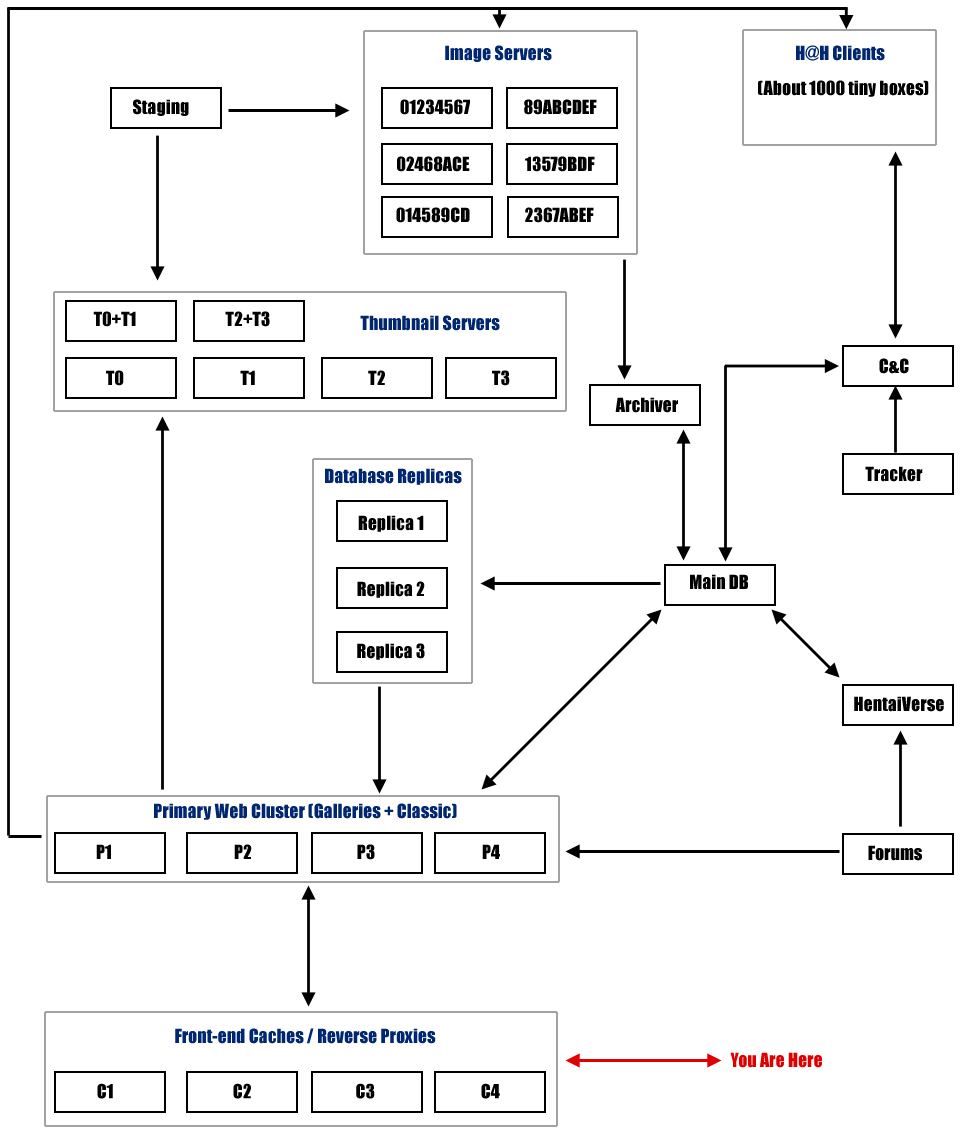
- Anatomy of the E-Hentai infrastructure (Missing chart image can be found here)